Fig. 1
From: Sex differences in the molecular signature of the developing mouse hippocampus

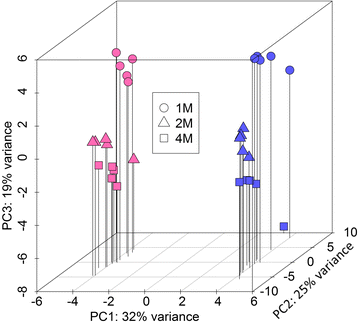
Principal component analysis. A 3D PCA plot was generated using normalized and variance stabilized transcript expression data (vst transformation, DESeq2) for the top 500 most variant transcripts in the dataset. The percent of variance explained by each principal comonent is displayed on each axis. Female samples (pink) and male samples (blue) cluster into two distinct groups on PC1. Within both the female and male clusters, samples of different ages (encoded by shape) cluster together on PC2 & PC3