Figure 5
From: Functional annotation of novel lineage-specific genes using co-expression and promoter analysis

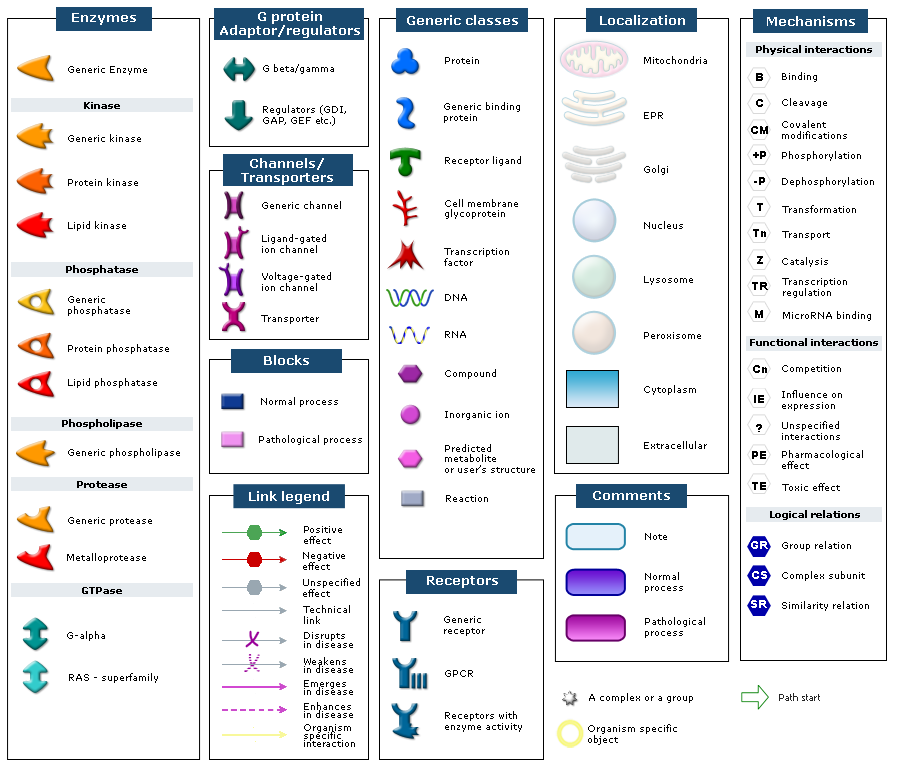
Interaction network for co-expressed genes in liver and the LIVR cluster showing roles in glycerophospholipid metabolism, protein transport, and signaling. LIVR cluster genes were analyzed using GeneGo MetaCore [32] and its human-specific interaction database. A sub-network was built starting with PLCE1, NGLY1, MX1, TRIP10 and ARF5, which are genes that are predicted to be co-regulated with 237NG and 266NG. Hub genes (IL22RA1, GGA1) predicted by WGCNA were then added to this network. Only interactions known to occur in liver tissue are shown as determined using a liver tissue trace in GeneGO. Majority of these are common to placenta tissue as determined using a placenta tissue trace. Those interactions that are specific to liver only are marked with the letter L. Genes that are expressed as part of the LIVR cluster are indicated with a red circle. A legend explaining the symbols is provided at http://portal.genego.com/legends/legend_6.png.