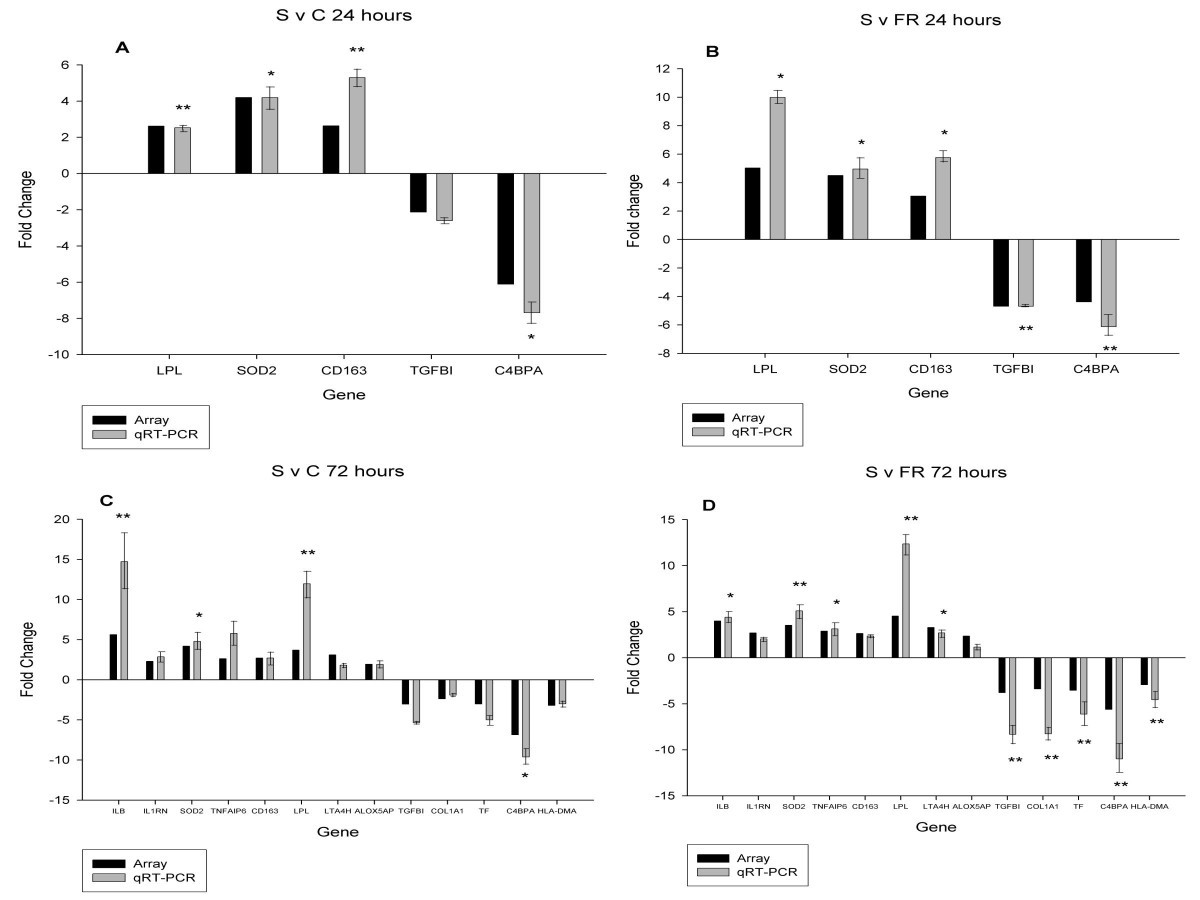
Figure 3
From: Gene expression profiling in the lungs of pigs with different susceptibilities to Glässer's disease

Comparison of relative expression differences for selected genes from the 'Susceptible' expression profiles determined by microarray and RT-qPCR. The relative expression fold change for genes identified as being differentially expressed in the (A) S v C comparison at 24 hours, (B) S v FR comparison at 24 hours, (C) S v C comparison at 72 hours, and (D) S v FR comparison at 72 hours. For each gene, the black bar indicates the expression ratio as determined by microarray; the grey bar indicates the expression ratio as determined by RT-qPCR, with associated standard error bars. Relative expression ratios are given as the ratio of the first group compared to the second (e.g. 'Susceptible' compared to 'Control' in the graph in panel A. Statistical significance of the relative expression ratio is indicated (* p < 0.05; ** p < 0.01). Results for RETN and LTF at 24 hours, and RETN and OAS2 at 72 hours were not plotted because of the axis scale chosen. The array fold changes for RETN and LTF at 24 hours in the S v C comparison were +12.77 and +16.45 whereas the RT-qPCR fold changes were +53.65 and +24.69 respectively. For the S v FR comparison at 24 hours the array fold changes were +14.93 and +9.13 whereas the RT-qPCR changes were +38.38 and +16.68 respectively. For the S v C comparison at 72 hours, the array fold changes for RETN and OAS2 were +13.00 and -9.58 whereas the RT-qPCR fold changes were +98.77 and -26.31 respectively. For the S v FR comparison at 72 hours, the array fold changes were +12.24 and -3.58 whereas the RT-qPCR fold changes were +66.20 and -20.00 respectively. All fold changes for RETN, LTF, and OAS2 measured by RT-qPCR were statistically significant (p < 0.01). Primer information is provided in additional file 5.