Figure 1

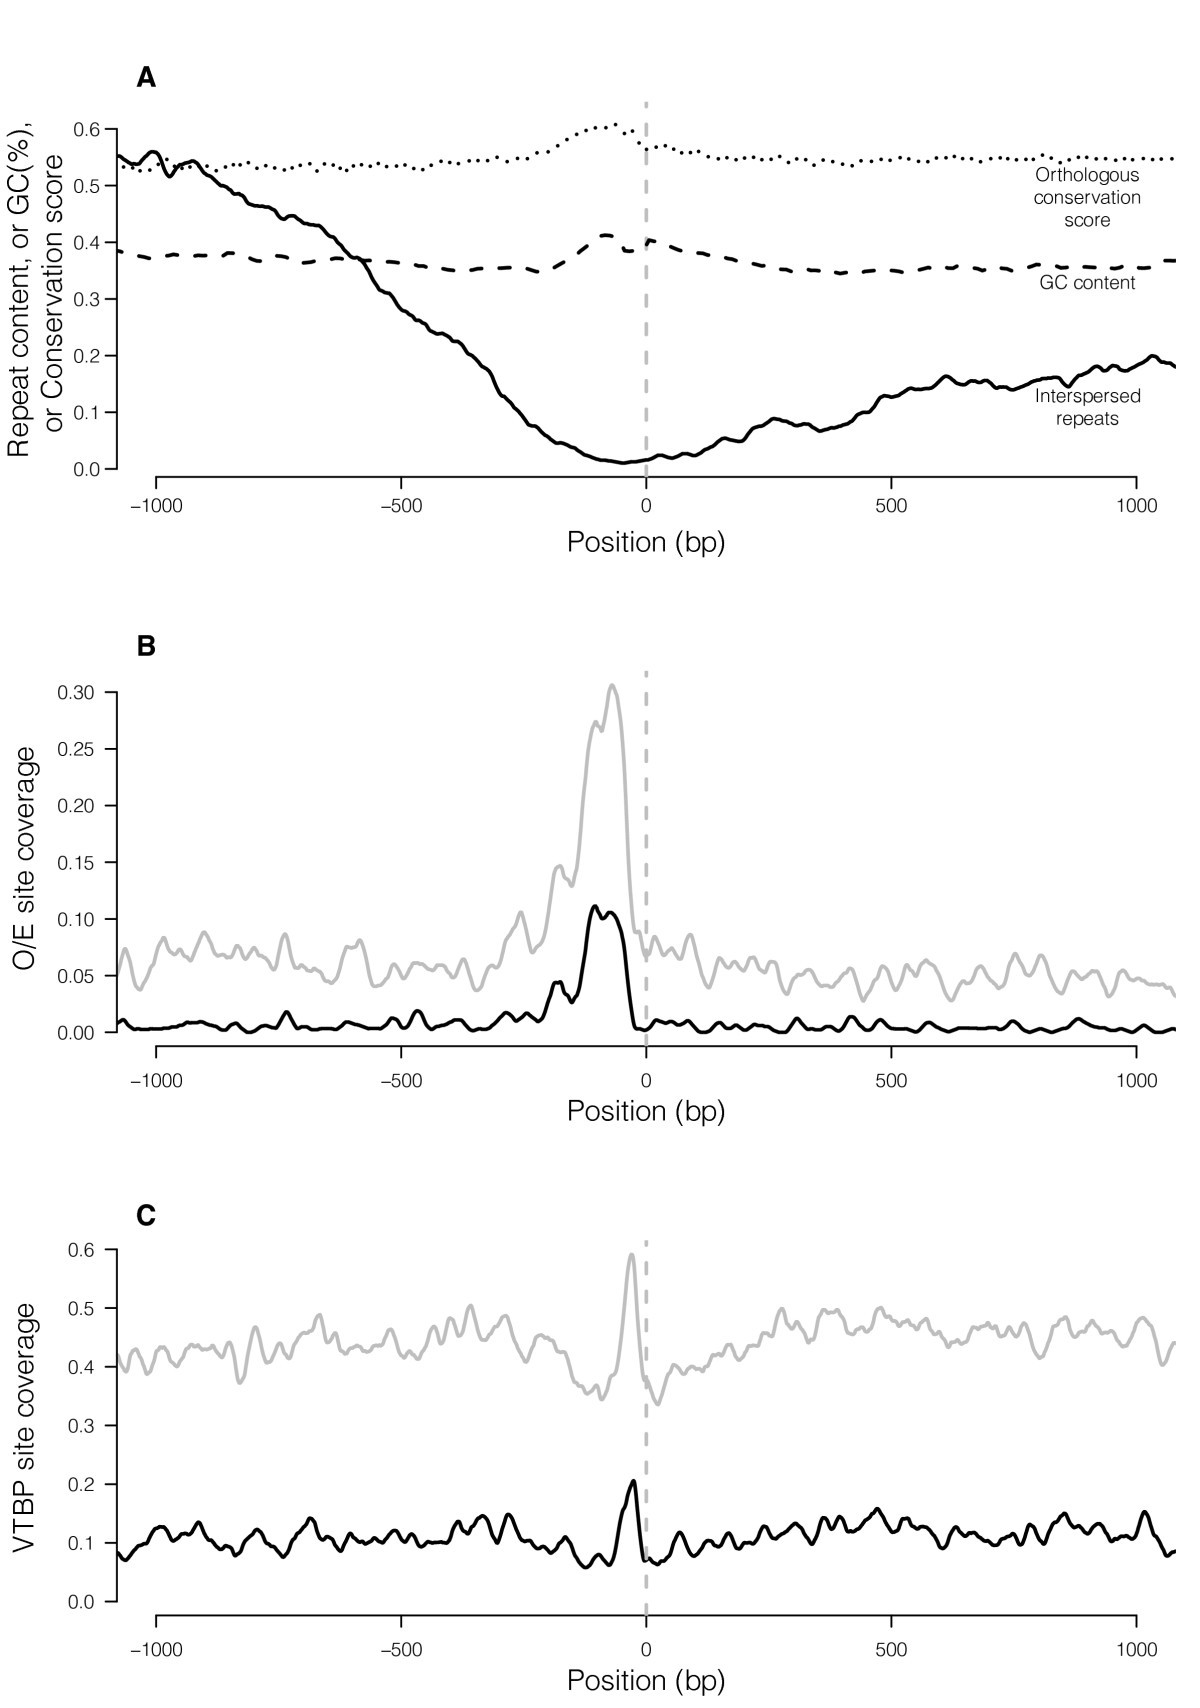
General characteristics of 314 putative OR promoter regions. Panel A. Interspersed repeat content, GC content and orthologous conservation scores in a 2-kb region surrounding the putative TSSs of 314 ORs. GC content is calculated in 50-bp windows across each sequence (with a 10-bp slide), then averaged across all sequences in the dataset, plotting values at the center of each window. Interspersed repeat content was determined by RepeatMasker and the proportion of promoters containing a repeat element at each base position relative to the TSS was calculated (averaged over 20-bp windows, sliding along promoters 1 bp at a time). An orthologous conservation score was calculated using SCONE [45]: the value plotted is 1 - P-value (SCONE output, see Methods) and is averaged over 20-bp windows, sliding along promoters 1 bp at a time. The vertical dashed gray line represents the predicted TSS. Panel B: Distribution of predicted O/E binding sites using MatInspector's default parameters ("opt", black line) or a reduced stringency ("opt-0.1", gray line) in the 314 sequences. Coverage is calculated as the proportion of promoter sequences containing a predicted O/E binding site at each base-pair, averaged over 20-bp windows, sliding along promoters 1 bp at a time. Panel C: Distribution of predicted TATA boxes using MatInspector's optimized score threshold (black line) or a less stringent threshold (gray line) (20-bp windows, 1-bp slide).