Figure 4
From: Sex-biased gene expression in the brown alga Fucus vesiculosus

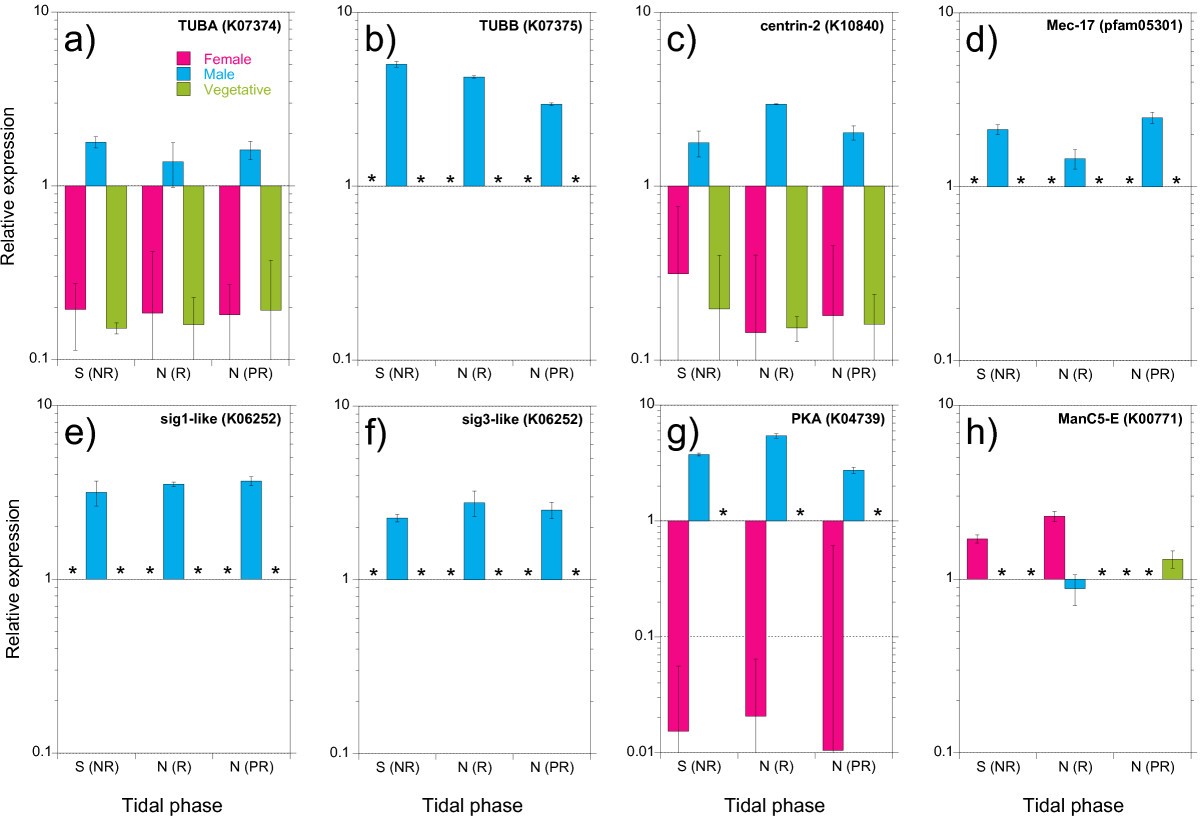
RT-qPCR analysis of gene expression for selected male- and female-biased genes. Values are relative expression (fold-change plotted on a Log scale, relative to a pool of all samples normalized to housekeepers EFd/b1 and SUMO3) for female (red), male (blue) and vegetative (green) tissue collected from the field during spring tide (S), and neap (N) tides. Genes were annotated based on homology to Ectocarpus siliculosus proteins, KEGG orthology, and/or Pfam databases; a) TUBA (α-tubulin), b) TUBB (β-tubulin), c) centrin-2, d) Mec-17-like protein (mechanosensitive touch receptor), e) Sig1 (diatom sex-induced gene homologue), f) Sig3, g) PKA (protein kinase A), and h) ManC5-E (mannuronan C5 epimerase). Asterisks indicate expression values below the cut-off for detection. (NR) = no gamete release, (R) = gamete release, and (PR) = post gamete release in the field. See Results for descriptions of gene targets.