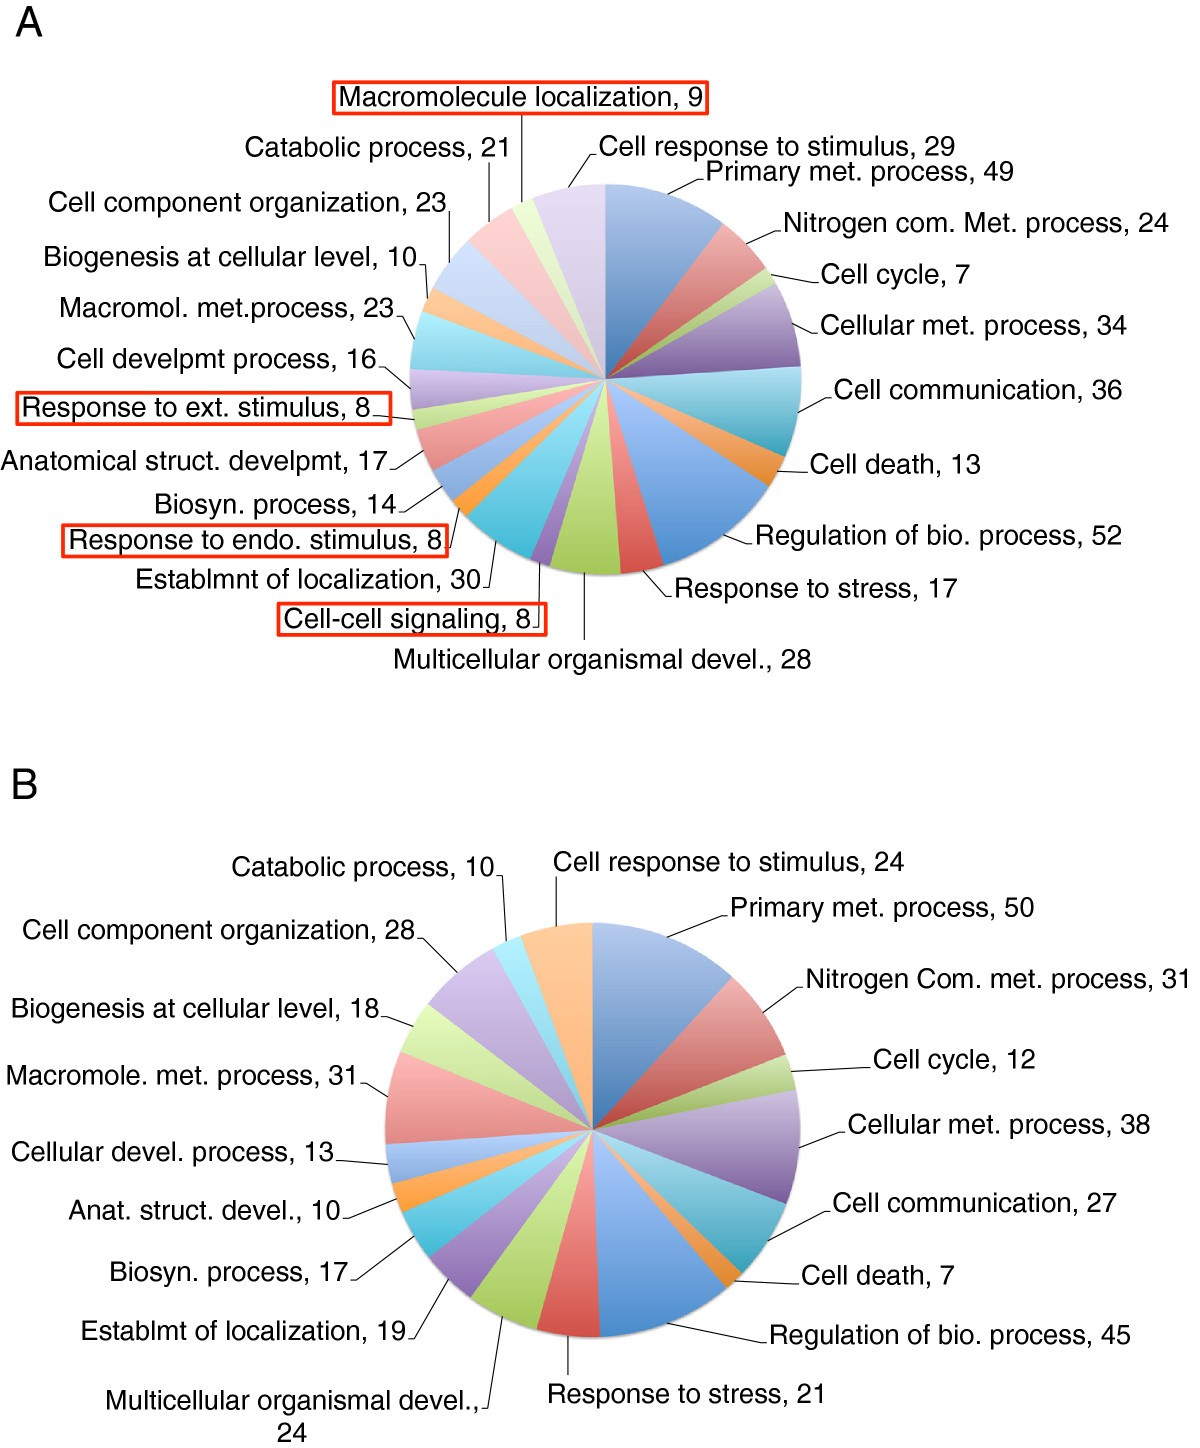
Figure 3

Functional annotation of differentially expressed genes based on Gene Ontology (GO) classification. Pie chart representing numbers of upregulated (A) from a total of 178 gene IDs and downregulated (B) from a total of 181 gene IDs in corresponding Gene Ontology Biological Process layer 2 categories in the mature R15 single neuron. Biological processes that are uniquely regulated are labeled using a red rectangle. Numbers show the unique hits corresponding to a biological process category.