Fig. 4
From: ATACseqQC: a Bioconductor package for post-alignment quality assessment of ATAC-seq data

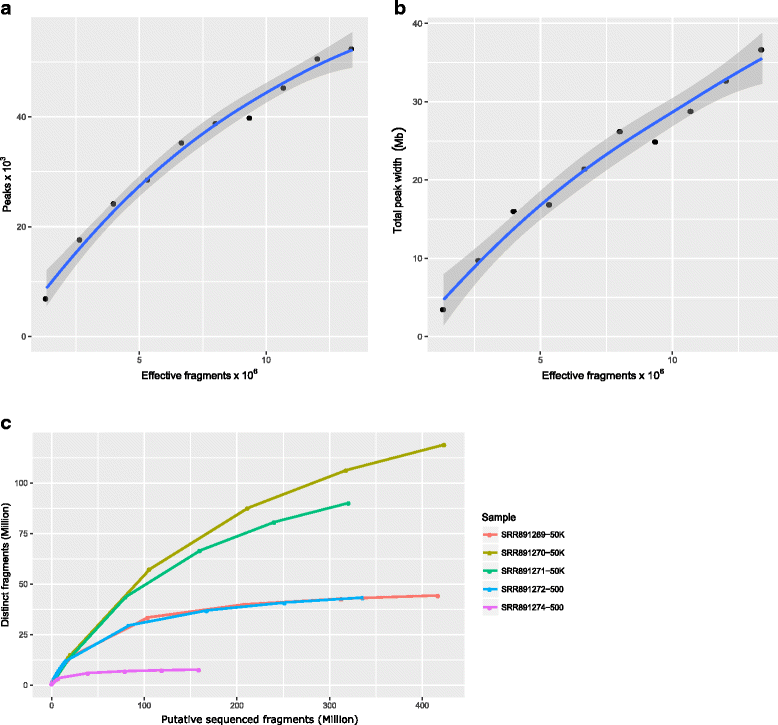
Sequence depth analysis and library complexity evaluation. It is important to know that it is not meaningful to perform saturation analysis of sequencing depth or library complexity for over-transposed ATAC-seq assays. (a) Total peak number-based saturation analysis of sequencing depth for SRR891270. Sequenced fragments in the filtered BAM file (called effective fragments here) are subsampled to get 10%, 20%, 30%…, 80% and 90% of total effective fragments. Broad peaks were called for each subsample and the full dataset using MACS2. The numbers of significant peaks (FDR ≤ 0.05) are plotted against the corresponding numbers of effective fragments. A smooth curve is fitted by using the geom_loess function in the ggplot2 package. The gray band shows the 95% confidence interval of the predicted peak numbers. (b) Total peak width-based saturation analysis of sequencing depth for SRR891270. The same procedure is used to fit the saturation curve except that the total width of significant peaks (FDR ≤ 0.05) for each subsample and the full dataset is used. (c) Library complexity analysis results for SRR891269-SRR891271, three biological replicates using 50 K cells, and for SRR891272 and SRR891274, two biological replicates using 500 cells. Number of distinct fragments was estimated for each given number of putative sequenced fragments free of mitochondrial reads