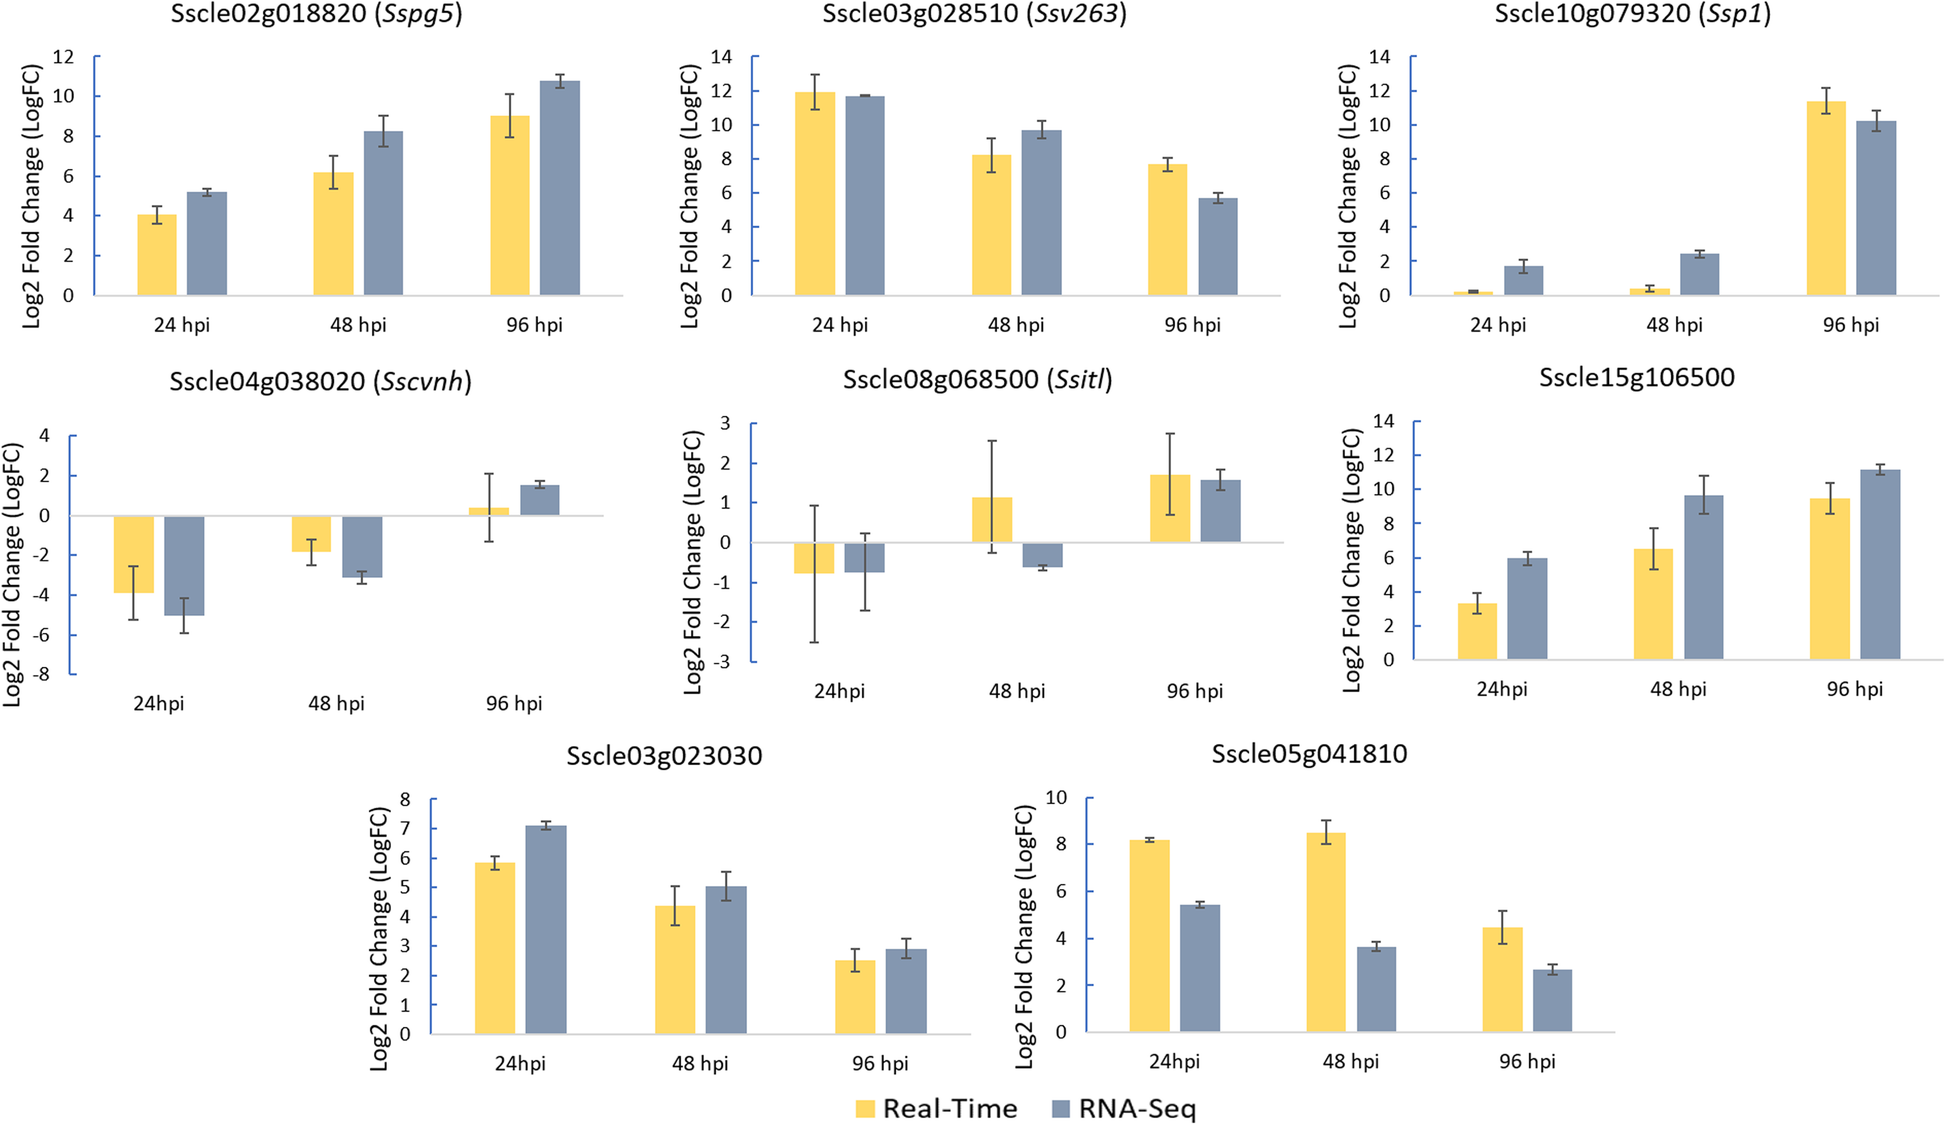
Fig. 2

Real-time quantitative PCR (RT-qPCR) validation of RNA Sequencing (RNA-Seq) data in the S line infection. Log2 Fold Change (LogFC) values were generated for RT-qPCR samples by comparing the expression of genes at each timepoint of infection vs. the culture control using the 2 − ΔΔCt method. LogFC values were generated for RNA-Seq samples by comparing the average RPKM values of genes at each timepoint of infection vs. the culture control. Data are presented as means ± standard error (SE) from three independent replicates