- Notes
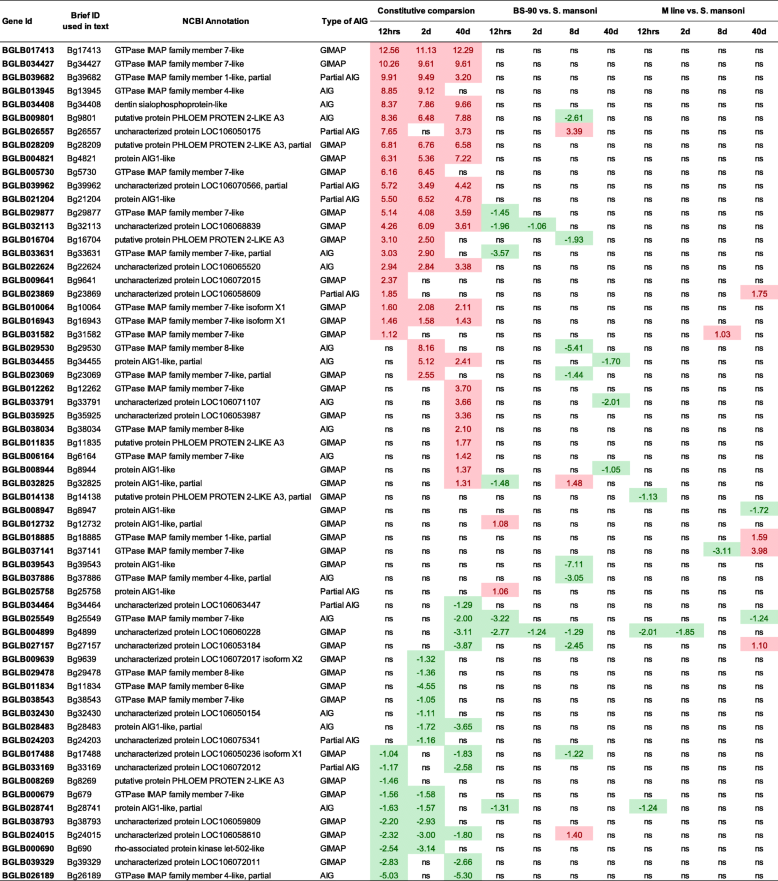
- 1. Value in cells represents the value of log2(fold change) of the gene. Any up-regualted DE gene with log2(fold change) greater than 1 is highlighted in red, and any down-regualted DE gene with log2(fold change) less than -1 is highlighted in green
- 2. The 12 h, 2d, 8d and 40d represent the 4 sampling time points, which are time-matched unexposed controls and exposed snails for comparison
- 3. ns: no significant expression difference detected. Gene with PPDE> 0.95 and fold change > 2 is considered to be differentially expressed in this study
- Shown are 3 comparisons of constitutive levels of AIG gene expression in BS-90 snails relative to M line snails (all snails were unexposed time-matched controls, with those at 0.5 and 2 dpe representing juvenile snails and those at 40 dpe being adult snails). Also, for both M line and BS-90 snails, there are 4 separate within strain comparisons of the effects of S. mansoni exposure (for 0.5, 2, 8 and 40 dpe) on AIG gene expression. Note that by 40 dpe, exposed BS-90 snails contain little or no S. mansoni DNA, and exposed M line snails were shedding cercariae
