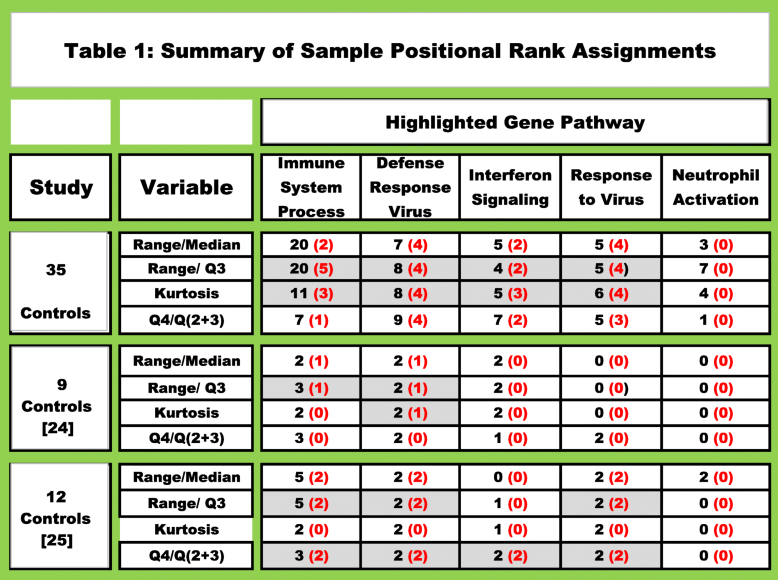
- Protein coding gene counts in three data sets were Minimum Value Adjusted (MVA) and rank ordered. The individual with the highest read count for any given gene was assigned a positional rank of 1, the second highest count was assigned a rank of 2, etc. until all of the samples received a positional gene assignment ranking (see Additional file 6). A scoring function was employed to identified a minimum of 1000 positionally ranked genes for each individual. The positionally ranked genes were evaluated to determine if any genes with range/median, range/Q3, kurtosis and Q4/Q(2 + 3) slope values were within a group of the top 300 genes previously identified for each of the selection parameters. For example, in a list of 1000 positionally ranked genes, only genes with a range/median value ≥ to the computed value of the 300th gene would be identified. The genes identified with these four parameters were subsequently evaluated with the STRING db to determine if they were associated with known biological pathways. The black font represents the number of times the designated pathway was ranked in the top 10 pathways in the 35 samples. The number highlighted in red font represents the number of individuals with a False Discover Rate (FDR) < E-15. Samples 4, 6, 9, 10, 12 and 33 all contained one or more pathways with FDR < E-15 to E-42 (Additional files 6, 8, 9). Range/Q3 and range/median calculations were the most robust parameters and identifying the largest number of pathway genes with the smallest FDR. Immune function pathways relating to defense response to virus, response to virus and type I interferon signaling pathways were highlighted in individuals 6, 9,10 and 12 with FDR’s from E-15 to E-26 when range/Q3, range/median or kurtosis values were used for gene identification and STRING-db analysis
