Fig. 2
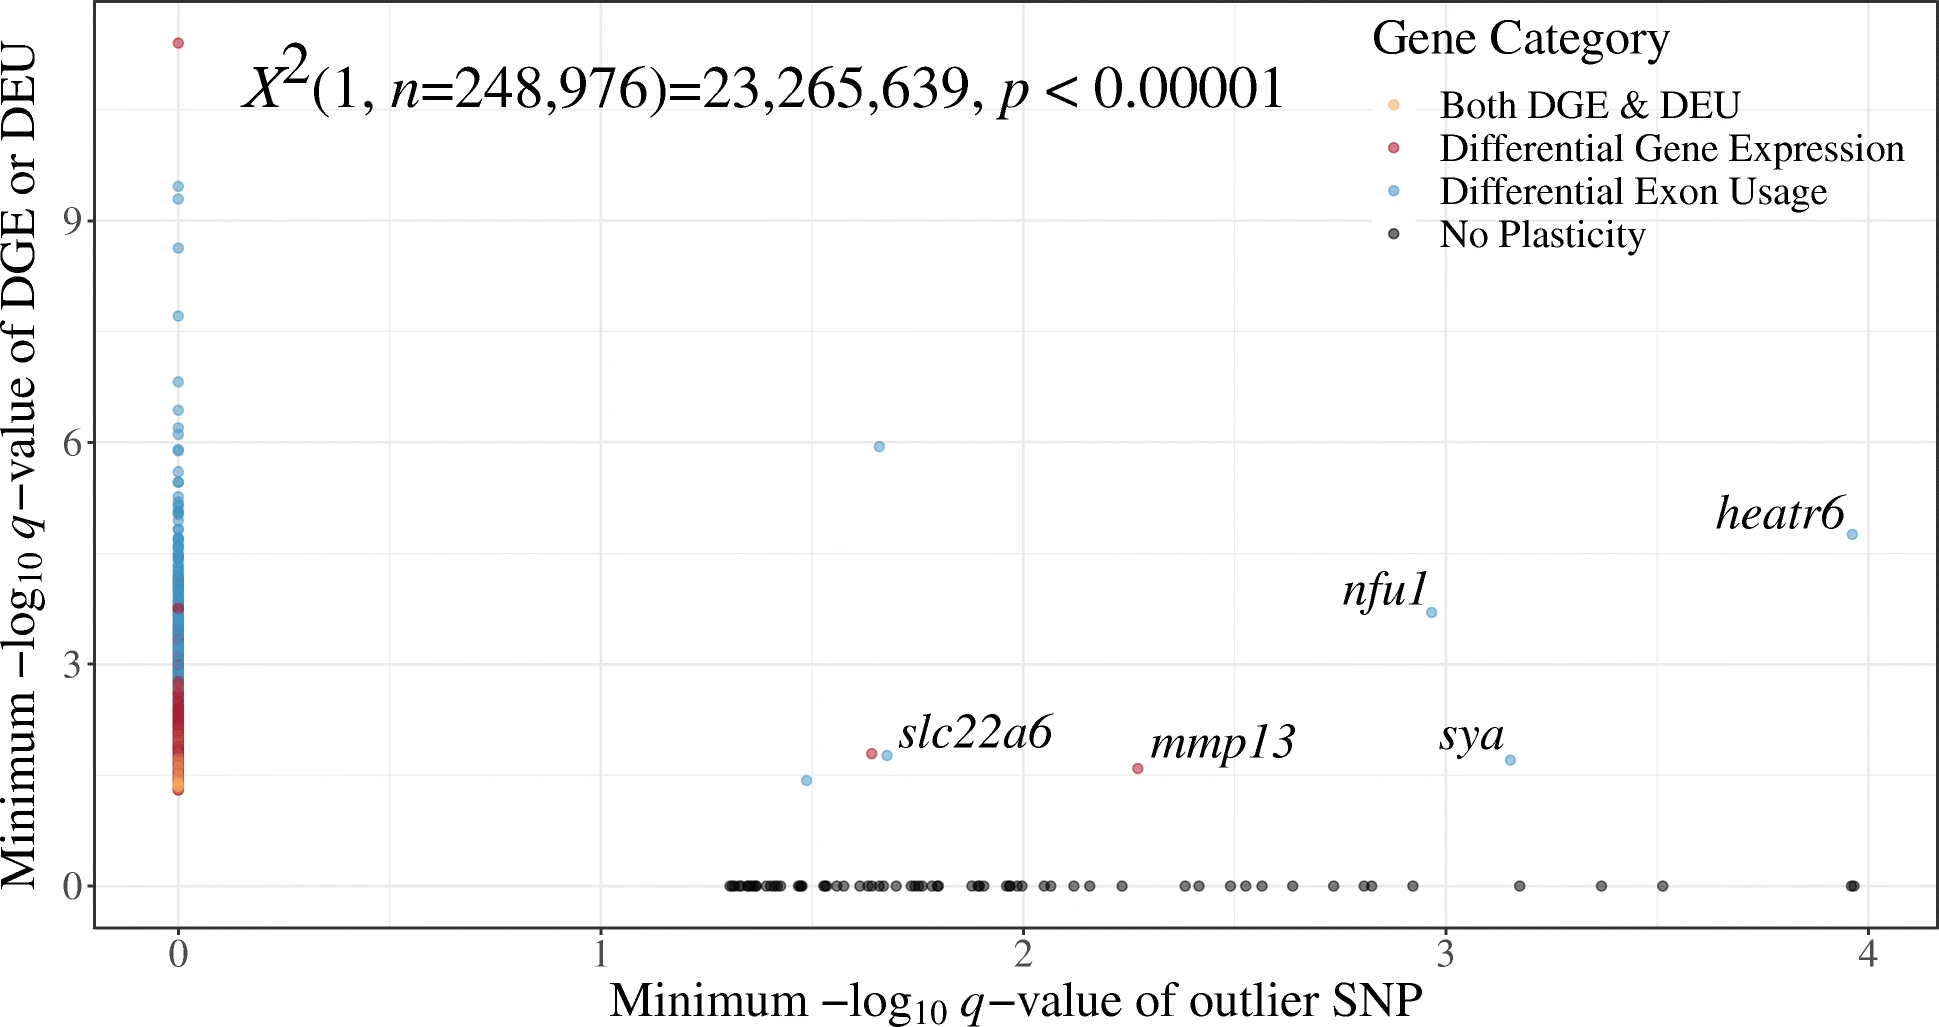
Phenotypic plasticity and signatures of selection in genes plotted by -log10 adjusted p-values (false discovery rates (q)) < 0.05. MRNA data consists of n = 16 individuals in each of two populations exposed to a salinity challenge over three timepoints. For visualization, the -log10 q-value for each gene from differential gene expression (DGE) or differential exon usage (DEU) in any comparison (within or between populations) was drawn and when multiple comparisons were significant (e.g. a gene showing DGE under multiple comparisons), the lowest -log10 q-value was retained for visualization. Signatures of selection were identified with SNPs that were significant between populations (q < 0.05). The lowest significant -log10 q-value was retained for visualization both between programs and in genes with multiple significant outlier SNPs. 244,089 genes showed no selection or plasticity, 67 showed selection and no plasticity, 4812 showed plasticity and no selection, and 8 showed both plasticity and selection. A Χ2 test of independence revealed independence between phenotypic plasticity and signatures of selection among genes Χ2(1, n = 248,976) = 22,651,453, p < 0.00001. Of the eight genes that show both signatures of selection and phenotypic plasticity, five had available annotations. HEAT repeat-containing protein 6 (heatr6), NFU 1 iron-sulfur cluster scaffold homolog (mitochondrial)(nfu1), alanine-tRNA ligase (sya), and solute carrier family 22 member 6 (slc22a6) each show DEU, while collagenase 3 (mmp13) shows DGE